
Performance Marketing & Full-Funnel Analytics for HNWI Investment Services
- Industry
- Investment-related advisory services
- Target audience
- HNWI, investors and entrepreneurs
- Reporting period
- April 1 - June 30, 2026
- Scope
- Paid acquisition, lead qualification tracking, CRM reporting and marketing analytics
1,059
Leads
76
Qualified Leads
1,896.32%
Reported ROMI
The Context
The business marketed investment-related services to an international audience, including high-net-worth individuals, entrepreneurs and investors.
The acquisition process involved several stages: advertising, lead capture, qualification, sales conversations and payments.
Measuring advertising performance only through clicks and lead costs did not provide enough information to evaluate commercial results.
The Challenge
A lower cost per lead does not necessarily mean better acquisition performance.
The business needed to track how leads progressed through qualification and sales, compare acquisition efficiency across sources and markets, and connect advertising costs to recorded payments and revenue.
This required reporting across both advertising platforms and CRM data.
What Was Implemented
Acquisition reporting
Campaign data was organized for analysis by advertising source, geography and campaign performance.
The reporting covered advertising spend, clicks, click-through rate, leads and cost per lead.
CRM qualification tracking
Lead data was connected to CRM qualification outcomes.
This made it possible to track qualified lead volume, cost per qualified lead and lead-to-qualified conversion.
Sales and revenue reporting
The reporting included payments, acquisition cost per sale, revenue and return on marketing investment.
Cohort-based results and actual cash payments were displayed separately to avoid mixing different reporting views.
Unified performance dashboard
A consolidated dashboard provided views by acquisition source, country or region, manager and advertising platform.
Marketing and sales metrics could be examined within the same reporting system.
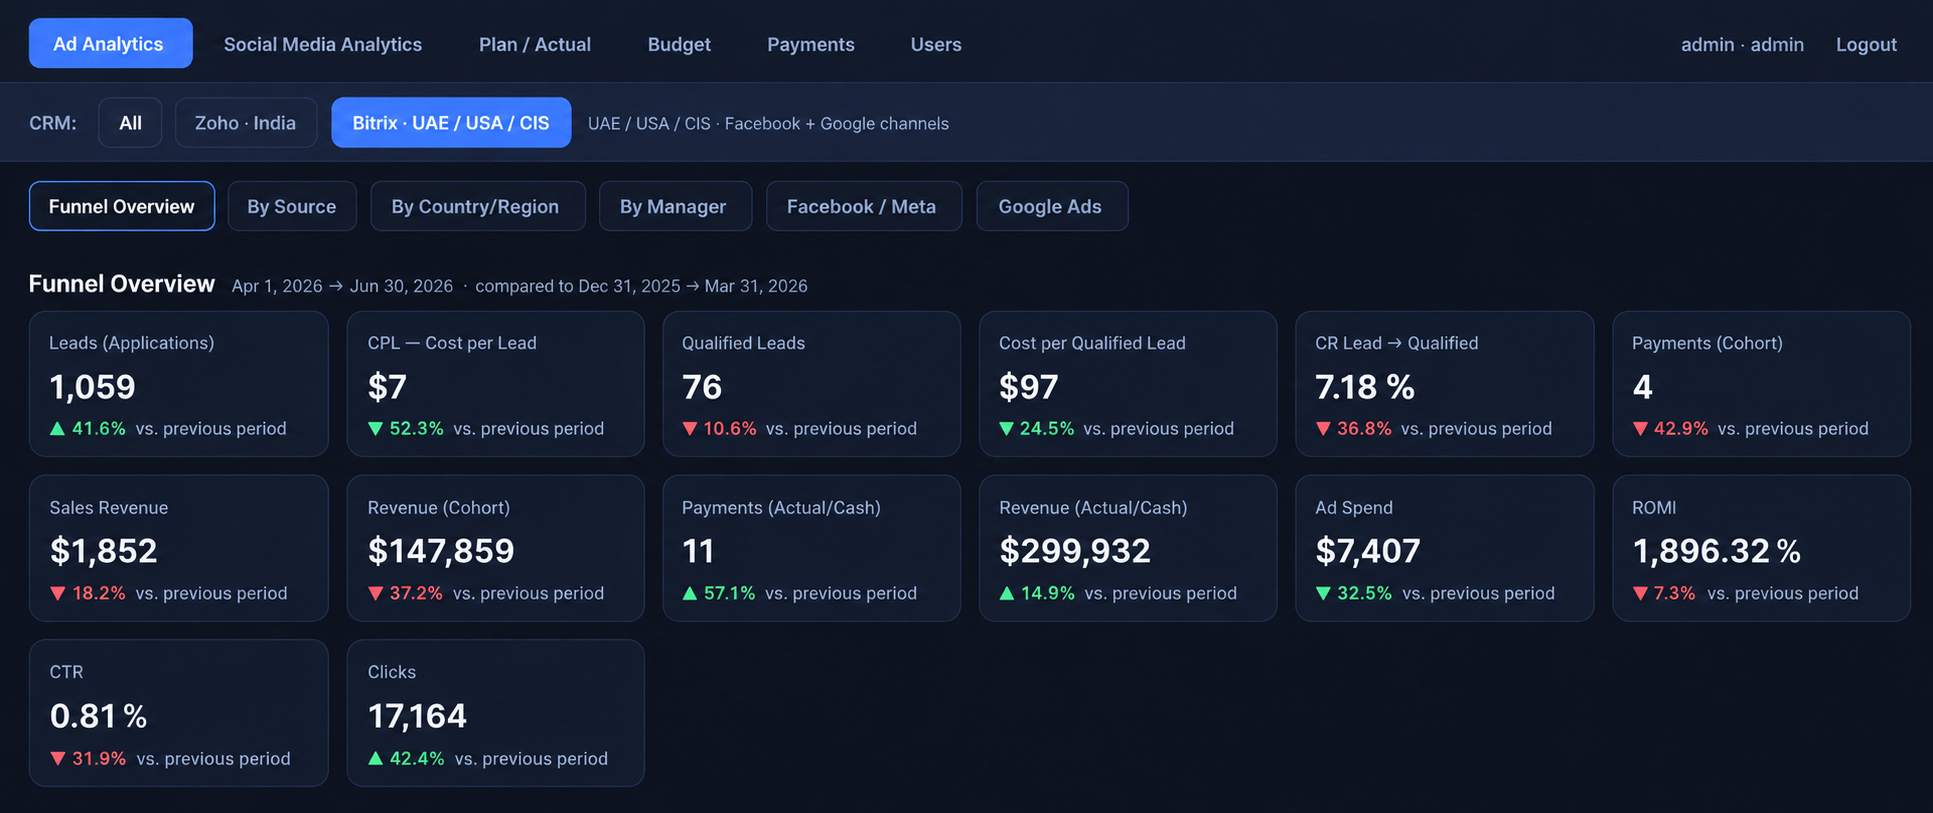
Performance Snapshot
April 1 - June 30, 2026
| Metric | Reported result |
|---|---|
| Advertising spend | $7,407 |
| Ad clicks | 17,164 |
| Leads | 1,059 |
| Cost per lead | $7 |
| Qualified leads | 76 |
| Cost per qualified lead | $97 |
| Lead-to-qualified conversion | 7.18% |
| Cohort payments | 4 |
| Cost per cohort sale | $1,852 |
| Cohort revenue | $147,859 |
| Reported ROMI | 1,896.32% |
Change vs. Previous Reporting Period
| Metric | Change |
|---|---|
| Lead volume | +41.6% |
| Cost per lead | -52.3% |
| Qualified leads | -10.6% |
| Cost per qualified lead | -24.5% |
| Lead-to-qualified conversion | -36.8% |
| Cohort payments | -42.9% |
| Cohort revenue | -37.2% |
What the Data Revealed
The reporting period showed a substantial improvement in top-of-funnel acquisition costs.
Lead volume increased by 41.6%, while CPL decreased by 52.3%.
However, qualified lead volume fell by 10.6%, and the lead-to-qualified conversion rate declined by 36.8%.
The cost per qualified lead improved by 24.5%, but fewer leads progressed through qualification and payment.
This distinction matters: lower CPL and lower qualified CPL did not translate into higher qualified lead volume or more sales during the measured period.
The dashboard made these differences visible in one reporting view, allowing campaign performance to be evaluated beyond lead generation alone.
Reporting Notes
- All figures refer to the selected reporting period and dashboard view.
- The reported 1,896.32% ROMI corresponds to cohort revenue of $147,859 against advertising spend of $7,407. It should not be confused with the separately reported cash revenue.
- Cohort payments and actual cash payments represent different reporting views and should not be added together.
- The HNWI designation describes the target audience, not a verified wealth classification of every submitted lead.
Need Visibility Beyond CPL?
Connect acquisition, qualification and sales performance.